By the end of this case-study chapter you will be able to:
read a realistic forestry or natural-resources question and decide what data-analysis steps are needed;
identify which functions from previous chapters are most efficient for the task;
combine skills from multiple chapters — import, inspect, clean, filter, mutate, group_by, summarise, pivot, left_join, visualize, and report;
justify why you chose one function or workflow over another;
check whether your results are plausible using row counts, missing-value checks, summary statistics, and visual inspection;
write a short interpretation for a non-technical forestry audience;
use AI as a verification partner without letting it decide the whole analysis.
Expected output for this chapter
TipWhat you will hand in
A short case-study report (rendered from a .qmd) that:
states a question in plain language;
shows your chosen workflow with a one-line justification for each step (“I used group_by() because …”);
includes one clear figure;
shows your plausibility checks (row counts, missing-value checks, summary statistics);
ends with a two- to three-sentence interpretation a non-technical forestry reader could follow.
10.1 Why this chapter is different
Every earlier chapter taught one main skill at a time — importing, cleaning, summarising, joining, or visualizing — and told you which one to practice. Real analysis does not arrive labelled. You are handed a question and a dataset, and you decide which tools to reach for and in what order.
The goal of this chapter is to move you from
“I know this chapter uses summarise()”
to
“I can decide whensummarise() is the right tool.”
10.2 The decision framework — think before you code
Before writing a single line, answer these six questions:
What is the unit of observation? One row = one what (a fiscal year? a station? a plot)?
Which columns do I actually need to answer the question?
Does anything need cleaning or recoding first (missing values, odd codes, a date to parse)?
What kind of problem is this — a filter, a grouped summary, a trend over time, a reshape, or a join?
Which function is the most efficient for that kind of problem — and what would be a slower but still-correct alternative?
How will I verify the result (row counts, n(), plausible ranges, a quick plot)?
Use this quick map from “kind of problem” to “reach for”:
The question is about …
Reach for
keeping only some rows
filter()
a new or derived column
mutate()
one number per group
group_by() + summarise()
how something changes over time
a trend plot (geom_line/geom_col)
the table being the wrong shape
pivot_longer() / pivot_wider()
combining two tables
left_join() (check keys + row counts)
showing the result to a person
ggplot2 + a clear caption
10.3 A worked example — the process end to end
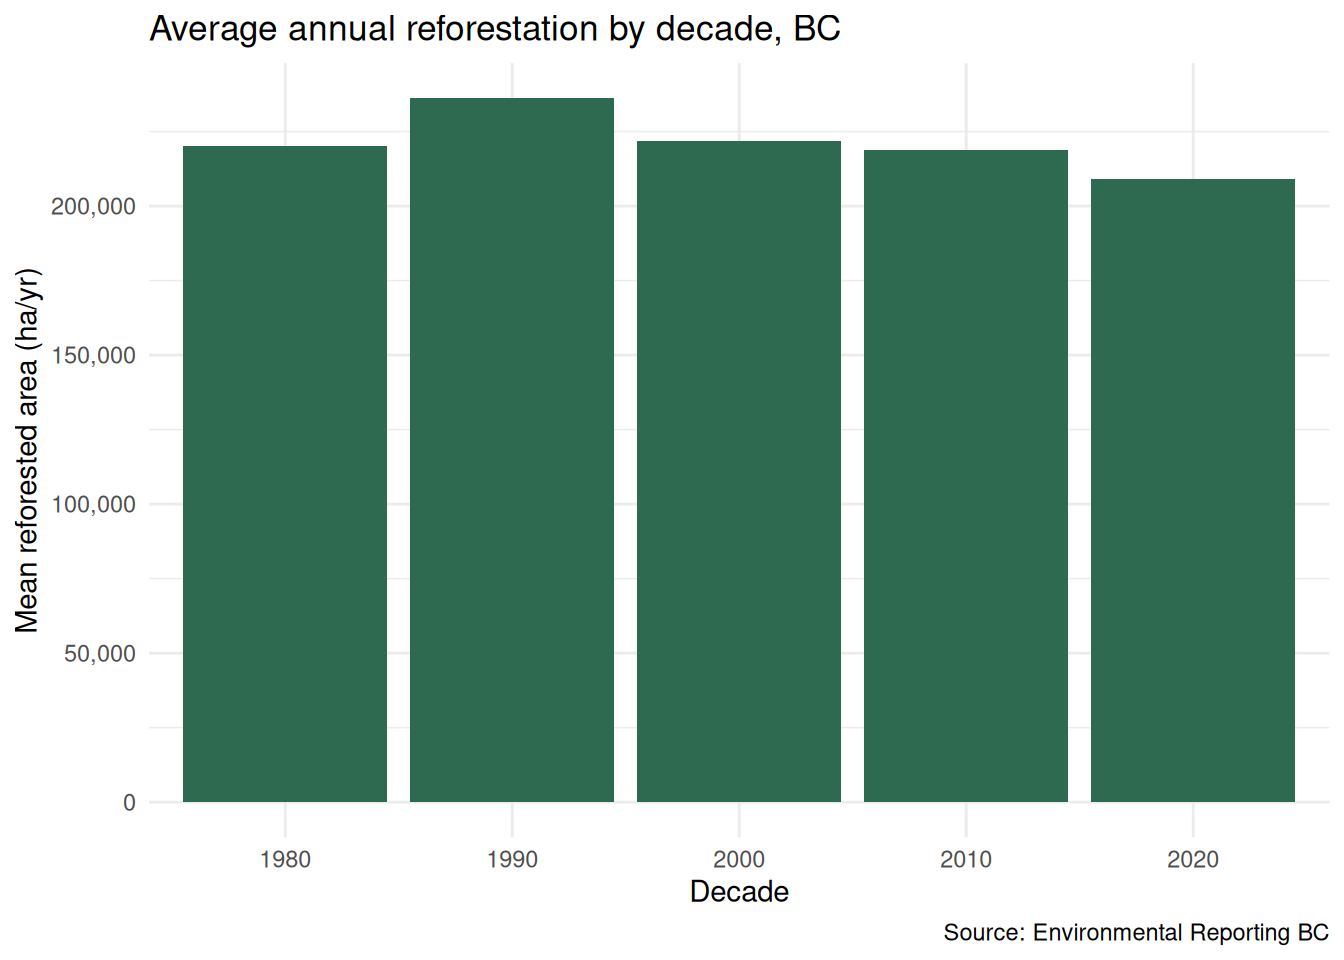
Question:Which decade saw the highest average reforestation in British Columbia, and how does it compare with harvesting?
Verify before trusting it:n_years should be small (about 10 per full decade, fewer for partial decades at the ends), and the hectare figures should sit in the hundred-thousands — both true above. A quick plot confirms the pattern:
by_decade |>ggplot(aes(x =factor(decade), y = mean_reforested_ha)) +geom_col(fill ="#2D6A4F") +scale_y_continuous(labels = scales::label_comma()) +labs(x ="Decade", y ="Mean reforested area (ha/yr)",title ="Average annual reforestation by decade, BC",caption ="Source: Environmental Reporting BC") +theme_minimal()
Mean annual reforested area (ha) by decade, British Columbia.
Interpret (for a non-technical reader):“On average, the decade with the highest annual reforestation was the one shown tallest above. Reforestation broadly tracks harvesting, but the two are not equal in every decade — a gap worth a second look.”
Notice what we did not do: no join (only one table), no reshape (the shape already answered the question). Choosing not to use a tool is part of choosing the right tool.
10.4 Choose the function — activities
For each task, decide the workflow before you write code.
Activity 1. You want one row per forest management category showing its total area and average age class.
Which function groups the data?
Which function calculates the summaries?
Which function sorts the result?
Which plot type would communicate it best?
What checks should you run before trusting the result?
Activity 2. You have a wide table with one column per year and want to plot area over time.
Is this a filtering, summarising, reshaping, joining, or visualization problem first? Which function do you reach for, and why?
Activity 3. You have a tree table and a separate species lookup table, and you want the species name (not code) on every tree row.
Which single verb does this? What must you check immediately afterward?
10.5 Integrated case-study questions — decide the tools
These need skills from several chapters at once. Do not jump to code — work through the framework questions first, then justify each step.
Question A.Which forest type or management category shows the largest change over time? Decide whether you need filter(), mutate(), group_by(), summarise(), arrange(), pivot_*(), left_join(), and/or ggplot() — and in what order.
Question B.Are years with more harvesting also years with more reforestation? Ask: what is the unit of observation? Is this a trend, a comparison, or a join problem? How would you show it, and how would you check the result is plausible?
For every question, be ready to answer:
What is the unit of observation?
Which columns are needed?
Do we need to clean or recode any values first?
Is this a grouped summary, a comparison, a trend, or a join?
What function is most efficient here — and what is a slower but valid alternative?
How can we verify the result?
10.6 Verify before you trust it
Run the checks that fit each step you took:
After you …
Check that …
import
rows, columns, and units look right; note missing values
filter()
the row count dropped by a sensible amount
summarise()
group sizes (n()) are reasonable and values are plausible
left_join()
the row count did not unexpectedly grow; note unmatched rows
plot
the figure answers the question and axis labels include units
10.7 AI as a verification partner — not the analyst
In this chapter especially, AI is a checking and debugging partner, not the decision-maker. It is easy for an assistant to pick a function before reading the question carefully, or to assume a column that is not in your file.
Decide the workflow yourself first; then ask AI to critique it.
Ask the AI to explain, not just produce code, and to list verification steps.
Watch for AI that chose a tool too quickly, ignored the unit of observation, or invented a column, function, or value.
The goal is not to make AI do the work. The goal is to use AI to help you understand, check, and improve your own reasoning.
10.8 Self-check quiz
You want the mean reforested area for each decade. The most efficient tools are —
filter() then arrange()
mutate() a decade column, then group_by(decade) |> summarise()
pivot_wider()
left_join()
One value per group = group_by() + summarise(); the decade first needs mutate(). No second table, so no join; the shape is already fine, so no pivot.
You need the species name from a lookup table added to every tree row. You should —
reshape the tree table with pivot_longer()
left_join() the lookup on the species key, then check the row count did not grow
summarise() the tree table
add the names by hand
Combining two tables on a shared key is a join. After a left_join(), verify the row count is unchanged — a non-unique key would multiply rows.
An AI suggests code that uses a column your file does not contain. This is an example of —
a reproducible workflow
a hallucination — verify against your actual data and the documentation
a valid shortcut you should submit
a facet
When AI invents a column, function, or value, that is a hallucination. Always check its output against your real data and the package documentation before using it.
10.9 Done
When your case-study .qmd renders cleanly — question, justified workflow, one figure, plausibility checks, and a plain-language interpretation — you have done the core skill of this course: turning a real question into a verified, reproducible answer.