11 Group Presentations and Portfolio Outputs
This chapter’s fresh dataset is the BC silviculture workbook (bc_disturbance_reforestation.xlsx) — click to download it into your data/ folder (source and details on the Datasets Used in This Book page). But your main inputs here are your own outputs from earlier chapters — the figures, cleaned tables, and rendered reports (and optional maps, only if your group used the spatial extension) that you will assemble into a presentation and a portfolio.
Chapter goals
By the end of this chapter you will be able to:
- Build a Quarto revealjs presentation by changing one line of YAML in a
.qmdfile. - Apply the one-idea-per-slide rule and use slide separators (
---or## Heading) effectively. - Embed R code chunks (charts, tables, and — only if your group used the optional spatial extension — maps) directly in slides so the slide refreshes whenever the data changes.
- Add incremental reveals, speaker notes, and footnote citations to slides.
- Assemble a portfolio — a single Quarto site or HTML collection — that showcases your best analyses from the earlier chapters.
- Cite data sources (BC Data Catalogue, Environmental Reporting BC) and R packages properly.
- Apply an open licence (CC BY 4.0) to your deliverables so they can be shared and built upon.
- Publish a rendered Quarto site to a free hosting service (Quarto Pub, GitHub Pages, Netlify).
Expected output for this chapter
- A rendered group presentation in revealjs HTML format, covering one analysis from the term (10–15 slides for a ~12-minute talk).
- A personal portfolio — at least three of your previous chapter deliverables (rendered HTML reports) collected into a single linked landing page.
- A citation file (
CITATION.md) listing the data sources, R packages, and any external code used. - A licence statement (CC BY 4.0 or equivalent) at the bottom of your portfolio landing page.
- The corresponding
.qmdsource files for both the presentation and the portfolio.
11.1 Where we are
Through the earlier chapters you produced a body of work: cleaned datasets, summary reports, and charts (and optional maps, only if you used the spatial extension). Each rendered HTML stands alone. This chapter is about packaging.
Two questions this chapter answers:
- How do I present what I built to a non-R audience in a 12-minute talk?
- How do I publish what I built so a future employer, TA, or classmate can find it and build on it?
Both answers use the same tool you have been using since Chapter 5: Quarto.
11.2 Quarto outputs — three formats from one file
The same .qmd source can produce different outputs by changing the YAML format field. Through this course you have already used:
format: |
What it produces |
|---|---|
html |
A single HTML report — your chapter deliverables. |
This chapter adds two more:
format: |
What it produces |
|---|---|
revealjs |
A revealjs HTML presentation (slides). |
pdf |
A printable PDF (requires a TeX install). |
A single Quarto project (a folder of .qmd files plus a _quarto.yml config) can produce all three formats from the same content. The same chart that appears on slide 7 of your revealjs talk can appear on page 12 of your PDF report and at section 3 of your HTML portfolio — without ever copy-pasting.
That single-source-many-outputs property is the difference between PowerPoint+Word+PDF as separate deliverables and Quarto as a publishing system.
11.3 PowerPoint-to-Quarto bridge
| What you would do in PowerPoint | What you do in Quarto revealjs |
|---|---|
| New slide | ## Slide title (h2 heading) or --- separator |
| Two-column layout | ::: {.columns} / ::: {.column width="50%"} |
| Title slide | YAML header (title:, subtitle:, author:) |
| Speaker notes | ::: {.notes} block |
| Animated reveal | ::: {.incremental} block or {.fragment} class |
| Paste a chart | An R code chunk that re-renders the chart |
| Paste a screenshot of a table | A kable() or gt() chunk that renders it live |
| Embed a video | <video> tag in HTML cell |
| Insert a footnote | ^[footnote text] or proper Markdown citation |
| Apply a template | theme: in YAML (default, dark, simple, sky, etc.) |
| Save as PDF | Render once to revealjs (HTML); press E key during the talk to export PDF |
| Edit the company logo every slide | Set it once in _quarto.yml; every slide inherits |
Every PowerPoint move has a Quarto equivalent, and most are one line of code instead of a menu hunt.
11.4 Your first revealjs file
Change one line of YAML at the top of any .qmd file:
---
title: "BC Reforestation Trends, 1987–2023"
author: "Your name"
date: today
format: revealjs
---
Render. Open the resulting .html. You are presenting.
11.4.1 Slide separators — two patterns
Inside the document, two patterns create a new slide:
Pattern 1 — heading-based:
## Slide 1 title

content

## Slide 2 title

more content
Each ## heading starts a new slide. Recommended for most talks — the title is built into the slide automatically.
Pattern 2 — horizontal-rule-based:
A slide with no title.

---

Another slide with no title.
The --- (three dashes on a blank line) creates an untitled slide. Useful for image-only slides or section transitions.
# Section Title(h1) — creates a section divider slide.## Slide title(h2) — creates a content slide.### Subheading(h3) — used within a slide.
A talk with three sections, each containing three slides, has # × 3 and ## × 9.
11.5 The one-idea-per-slide rule
The strongest discipline in slide design: one slide, one idea. If your slide has two unrelated points, split it.
Symptoms of slides that need splitting:
- More than ~50 words of body text.
- More than one chart per slide.
- A title with the word “and” in it (“Methods and Results”).
- Bullet points that wrap to a third line.
A revealjs deck of 20 short slides is almost always clearer than the same content jammed into 8 dense slides.
11.6 Embedding R output in slides
Code chunks work the same way in revealjs as in HTML reports — the output appears on the slide where the chunk lives:
## BC reforestation trend
::: {.cell}
::: {.cell-output-display}
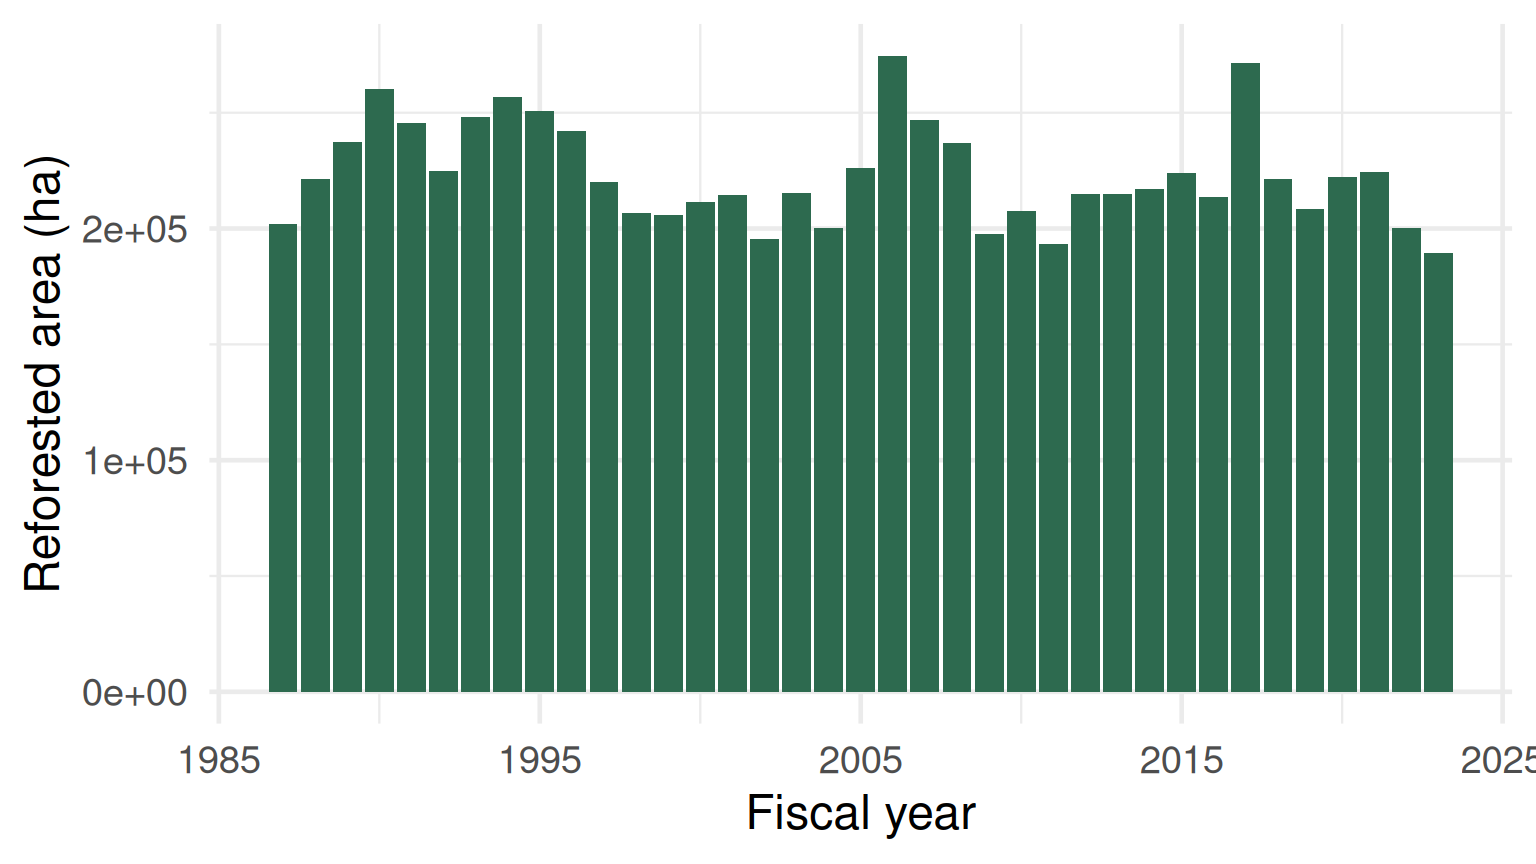{fig-alt='Bar chart of BC reforested area in hectares by fiscal year, used as a slide figure.' width=768}
:::
:::Notice the base_size = 18 — slide text needs to be larger than report text. A 12-point chart that reads fine in a printed report is illegible on a projector. Always increase font sizes in slide charts.
11.7 Speaker notes
A ::: {.notes} block adds notes that you see in presenter mode but the audience never sees:
## BC reforestation trend

[chart]

::: {.notes}
Talking points: emphasise the post-2010 increase, mention the
2018 dip caused by silviculture-budget cuts, prompt audience
to predict 2024.
:::
Press S during the live presentation to open presenter mode in a separate window.
11.8 Incremental reveals
Sometimes you want bullets to appear one at a time:
## Three findings

::: {.incremental}
- Reforestation has risen ~50% since 2010.
- Natural disturbance peaked in 2017 wildfires.
- The ratio reforestation : disturbance crossed 1 in 2019.
:::
The reader sees the first bullet, presses → to reveal the second, again for the third. Use sparingly — incremental reveals can frustrate audiences if overused.
11.9 Two-column layout
For comparing two charts or putting text next to an image:
## Static vs interactive charts

::: {.columns}
::: {.column width="50%"}
**Static** — `ggplot2`

- One PNG
- Fixed view
- Goes in printed reports
:::

::: {.column width="50%"}
**Interactive** — `plotly`

- HTML widget
- Hover, zoom, pan
- Goes in HTML deliverables
:::
:::
11.10 A complete revealjs .qmd skeleton
Copy this as a starting point for a 10-slide talk:
---
title: "BC Air Quality, January 2000"
subtitle: "An FRST 232 group presentation"
author: "Members A, B, C, D"
date: 2027-04-10
format:
  revealjs:
    theme: simple
    incremental: false
    transition: slide
    slide-number: true
    chalkboard: false
    embed-resources: true
    code-overflow: wrap
---

# Background

## The question

What did January 2000 PM2.5 look like across Metro Vancouver?

::: {.notes}
Set up the question — the file we cleaned in Ch 6 is hourly PM2.5
across 16 stations.
:::

## The data

::: {.incremental}
- 11,904 rows × 27 columns raw
- 16 stations across Metro Vancouver
- Source: Environmental Reporting BC
- Licence: Open Government Licence — BC
:::

# Cleaning

## The pipeline

[paste the Ch 6 dplyr pipeline as a code chunk with `echo: true`]

# Findings

## Per-station means

[paste the bar chart of mean PM2.5 by station]

## Regional differences

[paste the box plot from Ch 9]

## On a map (optional)

[If your group used the optional spatial extension, paste your leaflet map here.]

# Conclusion

## What we found

One sentence. Big and centered.

## Thank you

Questions?
Render. Adjust. Iterate.
11.11 Building a portfolio
A portfolio is a single landing page that links to your previously rendered analyses. Your future employer, TA, or classmate visits one URL and can browse everything you have built.
11.11.1 Simple folder structure
frst232/
├── _quarto.yml                  ← project config
├── index.qmd                    ← portfolio landing page
├── docs/                        ← rendered output (auto-generated)
└── chapters/
    ├── ch05.qmd
    ├── ch06.qmd
    ├── ...
11.11.2 Minimal _quarto.yml
project:
  type: website
  output-dir: docs

website:
  title: "FRST 232 — Forestry Data Analysis"
  navbar:
    left:
      - href: index.qmd
        text: Home
      - href: chapters/ch05.qmd
        text: Ch 5 — Inspection
      - href: chapters/ch06.qmd
        text: Ch 6 — Cleaning
      - href: chapters/ch07.qmd
        text: Ch 7 — Summarising
      - href: chapters/ch09.qmd
        text: Ch 9 — Charts
      - href: chapters/ch10.qmd
        text: Ch 10 — Case study

format:
  html:
    theme: cosmo
    toc: true
quarto render produces a complete navigable site in docs/. Drop that folder anywhere — a USB stick, a web server, GitHub Pages — and it renders as a real website.
11.11.3 A minimal index.qmd
---
title: "FRST 232 Portfolio"
---

# About this site

A collection of forestry data analyses produced for FRST 232
(UBC, Fall 2026). Each linked report covers a different
methodological topic, using openly licensed BC and Ontario
forestry data.

## Highlights

- [Chapter 6 — Cleaning the BC air-quality file](chapters/ch06.html)
- [Chapter 9 — Visualising reforestation trends](chapters/ch09.html)
- [Integrated Case Study — choosing the right tools](chapters/10-case-study.html)

## Author

Your name · [LinkedIn / email]

## Licence

All content © 2026 Your Name, released under
[CC BY 4.0](https://creativecommons.org/licenses/by/4.0/).
Code is released under the MIT licence.

## Data sources

- BC silviculture: Environmental Reporting BC
- BC air quality: Environmental Reporting BC
- Ontario forest stats: Government of Ontario
11.12 Citation — citing data, code, and packages
Every analysis you publish should make three things easy to find:
- The data source. Who published it? Where? Under what licence?
- The code dependencies. Which R packages did you use?
- The methods. Which previously published work did you build on?
11.12.1 A CITATION.md in your project root
# Citations

## Data

- BC Government, Environmental Reporting BC. *Trends in
  Silviculture in British Columbia*. Open Government Licence —
  BC. <https://catalogue.data.gov.bc.ca/dataset/indicator-summary-data-trends-in-silviculture-in-b-c->.
  Accessed 2026-09-15.

- Government of Ontario. *Forest Resources of Ontario 2021*.
  Open Government Licence — Ontario.
  Accessed 2026-09-22.

## R packages

- Wickham H et al. (2019). Welcome to the tidyverse. *Journal of
  Open Source Software*, 4(43), 1686.
- Pebesma E (2018). Simple Features for R: Standardized Support
  for Spatial Vector Data. *The R Journal* 10(1), 439–446.
- Cheng J, Karambelkar B, Xie Y (2024). leaflet: Create
  Interactive Web Maps with the JavaScript "Leaflet" Library.
In R, citation("package_name") returns the BibTeX entry for any package. Copy the entries into your CITATION.md.
11.13 Licensing — choose one openly
Three commonly used licences for student work:
| Licence | What it allows | When to use |
|---|---|---|
| CC BY 4.0 | Anyone can reuse and modify, as long as they credit you | Reports, charts, written analyses — the default for OER work. |
| CC BY-NC 4.0 | Same as above but no commercial use | If you want to restrict business reuse |
| MIT | Free reuse of code, must include copyright notice | Code (R scripts, Quarto sources) |
Many real-world projects combine: CC BY for prose and figures, MIT for code. Both can co-exist in one repository.
Add a one-line statement to the bottom of your portfolio:
© 2026 Your Name · Content licensed under CC BY 4.0 · Code under MIT11.14 Publishing — three free hosts
Once quarto render produces a docs/ folder, you can drop it on:
| Host | What it gives you | Effort |
|---|---|---|
| Quarto Pub | A unique URL like yourname.quarto.pub/portfolio/. Free. |
One command: quarto publish quarto-pub |
| GitHub Pages | Free hosting on yourname.github.io/repo-name. Needs a GitHub account. |
Push to GitHub, enable Pages in repo settings |
| Netlify | Same idea, more enterprise features. Free tier generous. | Drag-and-drop the docs/ folder onto the Netlify dashboard |
All three are zero-cost for student-scale traffic. The first one is the easiest by far — quarto publish quarto-pub from your project root, sign in, done.
11.15 Active learning
11.15.1 Activity 1 — Convert a chapter to slides
Take your frst232_ch09_learner.qmd (charts chapter). Change the YAML format: from html to revealjs. Re-render. Inspect what changes — which charts make readable slides, which need bigger fonts.
11.15.2 Activity 2 — One idea per slide
Take the rendered HTML from Activity 1. Identify any slide with more than one chart or more than ~50 words of text. Split each into two slides.
11.15.3 Activity 3 — Two-column layout
Build a two-column slide: left column has a chart, right column has three bullet takeaways.
11.15.4 Activity 4 — Citation
Run citation("tidyverse") and citation("sf") in the R console. Copy the output into a CITATION.md file in your frst232/ project root.
11.15.5 Activity 5 — Apply a licence
Add a one-line licence statement to the bottom of your index.qmd (CC BY 4.0 for content, MIT for code).
11.15.6 Activity 6 — Publish
Run quarto publish quarto-pub from your project root. Sign in to Quarto Pub when prompted. Confirm the resulting URL loads in a browser.
11.16 Practice Demo Lab — In-class presentations
This is a guided practice lab in the OER book, designed to help you learn the workflow before completing the official lab assignment on Canvas. The Canvas lab is the graded assignment. Use this activity to practice, compare your work with the reference solution, and learn how to write an AI verification prompt.
This demo lab has six parts — work them in order:
Your attempt. Work through the tasks below.
Reference solution. Compare against the worked examples earlier in this chapter (your public reference). The graded Canvas lab has its own private answer key — do not copy demo solutions into a Canvas submission.
Compare your work with the reference. Where did it match? Where did it differ? What caused the difference, and how did you fix it?
Write your own AI verification prompt. Ask an AI to check your reasoning, code, and outputs — not to produce the answer for you.
Model AI verification prompt.
“I am doing a FRST 232 practice demo lab. My dataset is
[file name](columns[columns]). I attempted[paste your steps or code]and got[paste the output]. Explain what my work does line by line, tell me whether it answers the task, and list the checks I can run to verify it against the chapter’s worked example. Do not give me the final answer.”Reflection: what changed after checking? In two or three sentences — did your attempt hold up? what did you fix? what will you check first next time?
The lab session for this chapter is given over to in-class group presentations. Each group presents one analysis from the term, using a revealjs deck they have built in advance.
Format
- 4 groups × 12 minutes each (10 min talk + 2 min Q&A).
- Each group covers one chapter’s headline analysis (e.g., Ch 6 cleaning, Ch 7 summarising, Ch 8 joining, or Ch 9 charts).
- Each group member speaks for at least 2 minutes.
Required slide structure
- Title slide — title, group members, date.
- The question — what forestry question are we answering?
- The data — source, licence, row/column counts.
- The method — show the actual R code (≤ 10 lines).
- The result — one chart, table, or map.
- Interpretation — one sentence headline + one paragraph nuance.
- Limitations — what does this analysis NOT show?
- Acknowledgements — citations of data sources and packages.
Peer evaluation
Every learner submits a peer-eval form for every other group, scoring:
- Clarity of the question (0–3)
- Quality of the slides (0–3)
- Depth of interpretation (0–3)
- Acknowledgement of limitations (0–3)
Submission
- The rendered revealjs HTML.
- The source
.qmd. - The peer-eval forms.
11.17 Exercises
These are the take-home exercises for this chapter.
Change the format. Take any Chapter 5–11 learner
.qmdyou have rendered. Change the YAMLformat:line fromhtmltorevealjs. Re-render. What changes?Slide separators. In your converted file, identify three places where you should add
##headings or---separators to break a long page into multiple slides.One slide, one chart. Refactor one chapter so each slide contains exactly one chart (or table, or map). Compare the new deck length to the original page count.
Speaker notes. Add
::: {.notes}blocks to three of your slides with talking points only you will see.Two-column layout. Build one slide with a two-column layout — a chart on the left, three bullet takeaways on the right.
Build a portfolio. Create
_quarto.yml,index.qmd, and a navbar that links to at least three of your previous chapter deliverables. Runquarto renderand inspect the resultingdocs/folder.CITATION.md. Write a
CITATION.mdfile listing your three data sources and at least five R packages you used through the course.Publish. Run
quarto publish quarto-puband share the resulting URL with one classmate. Confirm it loads on their computer without any R install.
11.18 Optional, advanced
11.18.1 Slide themes and templates
revealjs ships with multiple built-in themes:
format:
  revealjs:
    theme: [default, dark, sky, beige, simple, serif, blood, night, moon, solarized]
Pick one that matches the venue. For most academic/professional talks, simple or serif is safest. dark works well in dim conference rooms.
11.18.2 Custom CSS
If a built-in theme is not quite right:
format:
  revealjs:
    theme: simple
    css: my-custom.css
Then in my-custom.css:
.reveal h1, .reveal h2, .reveal h3 {
  color: #1B4332;
}
.reveal blockquote {
  border-left: 4px solid #2D6A4F;
  padding-left: 1em;
}
11.18.3 Print to PDF during the talk
While presenting in revealjs, press E to enter print mode, then Ctrl+P / Cmd+P to save as PDF. Useful for handouts.
11.19 A glimpse ahead: Wrap-up and final exam preparation
The final chapter is the term-end consolidation:
- A complete review of all 12 chapters.
- The Excel-to-R bridge in one summary table.
- The final-exam structure and topics.
- Where to go next: advanced R, dedicated GIS courses, reproducibility frameworks.
The chapter lab is the final exam itself — closed-AI, open-notes, covering the whole course.
11.20 Self-assessment quiz
- Every code chunk
- The YAML
format:line from html to revealjs - The entire R session
- Nothing — they are the same
- Use exactly one word per slide
- Each slide should make one clear point — split if you have two unrelated ideas
- Use one slide per chapter
- It is just a suggestion
- Pressing Enter twice
- A `## ` heading or a `---` horizontal rule on a blank line
- A {slide} block
- A separate file per slide
- A regular content slide
- A section-divider slide between groups of content slides
- An error
- A speaker note
- Code that does not run
- Speaker notes — visible to you in presenter mode, hidden from the audience
- Footnotes
- References
- Do not run
- Run and embed their output (charts, tables, maps) on the slide where they live
- Run only on the title slide
- Require a separate library
- A smaller font than for a report
- A larger base_size (e.g., 16–20) so the chart reads on a projector
- No font change
- Black text only
- A loop in the code
- Bullets that appear one at a time as the presenter advances
- A counter
- A footnote
- Two separate files
- A `::: {.columns}` parent block with two `::: {.column width="50%"}` child blocks
- A table
- Tabs
- A single document
- A Quarto website (one landing page + multiple linked chapter deliverables) showcasing your best work
- A printed binder
- A LinkedIn profile
- A data file
- The project config file that defines the site's structure, navigation, and format defaults
- A backup file
- Optional metadata
- help(package)
- citation("package_name") in the R console
- summary(package)
- There is no standard way
- Prohibits commercial use
- Allows anyone to reuse and adapt your work, as long as they credit you
- Requires payment
- Only applies to code
- CC BY 4.0
- Open Government Licence — British Columbia (OGL-BC)
- MIT
- Proprietary
quarto publish quarto-pub does what?- Saves a local PDF
- Uploads the rendered site to Quarto Pub (free hosting) and gives you a public URL
- Compiles the document
- Installs Quarto
- Saves the file
- Opens presenter mode in a separate window, showing speaker notes and the next slide
- Stops the slideshow
- Searches the slides
- Smaller file size
- Charts and tables re-render automatically when the underlying R code changes — no copy-pasting
- Animations
- More fonts
- A list of your hobbies
- A "limitations" slide that names what the analysis does NOT show
- A long bio
- An advertisement
- Word, Excel, PowerPoint
- Quarto Pub, GitHub Pages, Netlify
- AWS, GCP, Azure (paid)
- Dropbox, Google Drive, OneDrive
11.21 AI as a debugging companion
“My revealjs slide has too much text. Help me split it into three shorter slides.” (Paste the slide content.)
“My ggplot chart looks fine in HTML but the labels are tiny on the projector. What do I change?” (Answer: increase
base_sizeintheme_*(base_size = 18).)“Write a CITATION.md entry for the readxl R package.”
11.22 Reading
- Quarto Presentations guide — the canonical reference: https://quarto.org/docs/presentations/revealjs/
- Quarto Websites guide: https://quarto.org/docs/websites/
- Nancy Duarte, Slide:ology — short, opinionated, and the single best one-book primer on slide design.
- Creative Commons licence chooser: https://creativecommons.org/choose/
- Open Government Licence — BC: https://www2.gov.bc.ca/gov/content/data/policy-standards/open-data/open-government-licence-bc